Today at Browserling I was analyzing how to lower the costs for the Rackspace cloud servers. I noticed that the monthly outgoing traffic bill was higher than expected so I decided to find out which servers used the most traffic.
I opened a chat session with Rackspace's fanatical support team and asked where I could find such information. Unfortunately they didn't have outgoing bandwidth summary for each server. They did however direct me to a CSV file with thousands of lines of entries detailing every charge made to the account, including bandwidth.
I used my Perl one-liner skills and within a few minutes had the breakdown of bandwidth usage for every server. In this article I'll recreate the one-liner and turn it into a Perl program that you can use to create the traffic breakdown yourself.
CSV File
You can find the CSV file if you go to Billing and Payments, and then click on an invoice number.
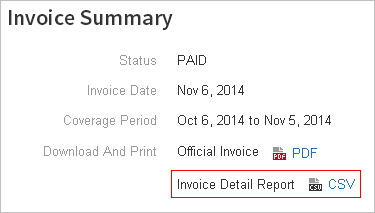 The CVS file detailing every charge is located on the invoice page.
The file contains thousands of lines detailing every charge, including bandwidth, storage, and cloud servers usage. You'll need to filter the lines that contain the bandwidth charges. A Perl one-liner can easily filter the necessary lines and sum the values for every server.
Perl One-Liner
There are a dozen columns in the file separated by a comma. You can either use a proper CSV parsing module or you can write a quick hack, split the fields on the comma, sum things up, get things done and move on. That's what I did. I love getting things done.
The sixth column in the CSV file describes the charge type. For the outgoing bandwidth this field is either Legacy Server BWOUT for First generation servers or NG Server BWOUT for Next generation servers.
The tenth column shows the amount of traffic used by the server, and the eighteenth column contains the server name.
All the one-liner has to do is create a hash with the eighteenth column as the key and sum the traffic values in the tenth column. After the file has been processed all you need to do is sort the hash by values and print the key, value pairs.
perl -F, -lane '
  if ($F[5] =~ /Server BWOUT/) {
    $h{$F[17]} += $F[9]
  }
  END {
    printf "%s: %.02f GB\n", $_, $h{$_} for sort { $h{$b} <=> $h{$a} } keys %h
  }
' file.csv
Here's the output it produces:
server1: 101.62 GB
server2: 94.19 GB
server3: 91.48 GB
...
I now knew which servers exactly used the most bandwidth and I could proceed to analyzing why they were sending out so much data.
Perl Program For Traffic Breakdown
One-liners are quick throw-away hacks to get the things done and move on. They don't make good programs. I rewrote the Perl one-liner in modern Perl and used a proper CSV module to parse the file.
#!/usr/bin/perl

use warnings;
use strict;

use Text::CSV;

# Rackspace Invoice CSV columns
use constant {
    ACCOUNT_NO => 0,
    BILL_NO => 1,
    BILL_START_DATE => 2,
    BILL_END_DATE => 3,
    SERVICE_TYPE => 4,
    EVENT_TYPE => 5,
    EVENT_START_DATE => 6,
    EVENT_END_DATE => 7,
    IMPACT_TYPE => 8,
    QUANTITY => 9,
    UOM => 10,
    RATE => 11,
    AMOUNT => 12,
    USAGE_RECORD_ID => 13,
    DC_ID => 14,
    REGION_ID => 15,
    RES_ID => 16,
    RES_NAME => 17,
    ATTRIBUTE_1 => 18,
    ATTRIBUTE_2 => 19,
    ATTRIBUTE_3 => 20
};

my $csvFile = shift or die "usage: $0 <csv file>";
my $csv = Text::CSV->new;

open my $file, '<', $csvFile or die "unable to open $csvFile: $!";

my %bandwidth;
while (my $row = $csv->getline($file)) {
    if ($row->[EVENT_TYPE] =~ /Server BWOUT/) {
        $bandwidth{$row->[RES_NAME]} += $row->[QUANTITY];
    }
}

for my $server (sort { $bandwidth{$b} <=> $bandwidth{$a} } keys %bandwidth) {
    printf "%s: %.02f GB\n", $server, $bandwidth{$server}
}
Download: rackspace-traffic.pl. You can contribute to the project at github: rackspace-traffic.
I also created a profile at Rackspace community and I'll repost this article there. It looks like a fun place to hang out. Rackers are great people.
Until next time!